
Software · LI Control
Your entire city. One dashboard.
LI Control is the web-based platform for monitoring, controlling and maintaining your entire street lighting infrastructure – built for cities, municipal utilities and infrastructure operators. Engineered for maximum security, with traceable logs for every operation.
For cities & municipal utilities
Built for municipal operations.
Street lighting is critical infrastructure – with tight budgets, documentation duties and assets that grew over decades. LI Control is made exactly for that: for everyday work in public works departments and control rooms, not for the trade-show booth.
No lock-in
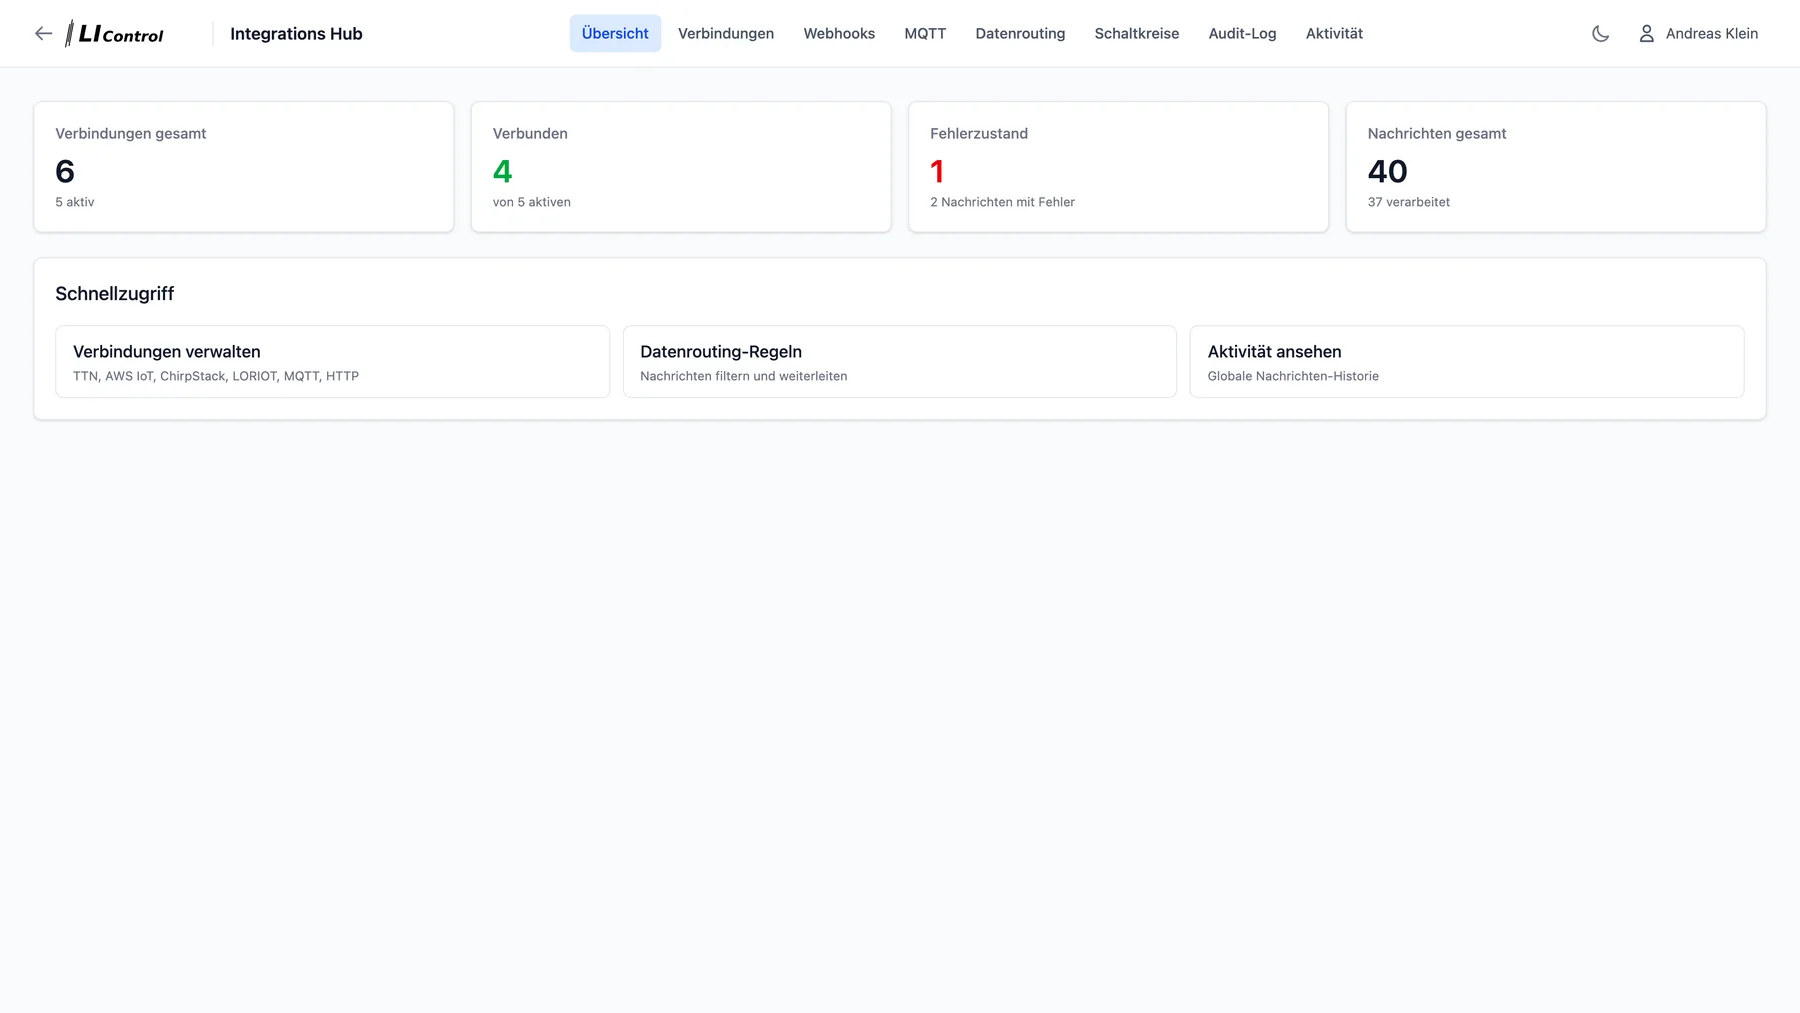
Open interfaces instead of vendor lock-in: LoRaWAN via The Things Network, ChirpStack or LORIOT, NB-IoT, MQTT and webhooks.
Verifiable & audit-proof
Complete maintenance history and audit trail with before/after values – solid evidence for insurers, audits and councils.
Ready in minutes
Your existing luminaire inventory is imported from Excel in minutes – no tedious retyping.
Security first
Engineered for maximum security.
Street lighting is critical infrastructure – which is why security in LI Control is not an add-on module but the foundation. Every switching command, every change, every login leaves a traceable log entry: who did what, when, and with what result.
Role model
From administrator via operator and field technician to read-only access for councils – everyone sees exactly what their job requires.
Logs for every detail
Switching commands, configuration changes, user actions, integration events – documented end to end with person, timestamp and before/after values.
Signed interfaces
HMAC-SHA256-signed webhooks, masked credentials and API keys with scoped permissions.
Hosting your way
Cloud operation or installation on your own infrastructure – your operational data stays under your control.
Interactive map
Your city. Live.
Every luminaire with its location and status on one map – from the city-wide overview down to the individual light in its detail view.
Status at a glance
On, off, dimmed or faulty – colour-coded across the whole city, with search by luminaire or street.
Heatmap views
Temperature, tilt and ambient light as map overlays – spot anomalies instantly instead of combing through lists.
Area selection
Select entire street sections with polygon or circle tools and switch or dim them together.
Filters that match your city
Hierarchical by city, district and street – organised the way your inventory actually is.
Schedules
Light that follows the sun.
Astronomical calendars compute sunrise and sunset automatically. Profiles like the residential night setback run all year round – no manual adjustment.
- Astronomical calendar
- Switching times relative to sunrise and sunset with a freely configurable offset – adapts to every season automatically.
- 24-hour brightness profiles
- Brightness per hour or in 15-minute steps, with separate profiles for weekdays and weekends, summer and winter.
- Runs on the controller
- Profiles are pushed to the device and keep running autonomously on its real-time clock – even if the radio link goes down.
- Demand-driven night setback
- Dimmed off-peak hours cut energy use and light pollution – tuned individually per residential area, main road or sports ground.
Control & groups
Hundreds of lights. One click.
Group luminaires by street, district or use case and switch, dim and monitor them together – with feedback from every single light.
- Stepless dimming
- 0–100 % via DALI-2 – per light, per group or as a broadcast across the entire inventory.
- Confirmed commands
- Every switching command is acknowledged per light – you see in black and white what actually arrived.
- Group calendar profiles
- Reusable profiles per group – summer, winter, public holiday – pushed to all lights with one click.
- Traceable history
- Who switched what, and when? Every action documented – including a command log per group.
Energy & CO₂
Make consumption visible. Cut costs.
Real-time energy consumption per light and in total, meter management for cost allocation, and automatic reports with concrete recommendations – your digital energy advisor.
kWh
consumption per light – live and historical
1 year
of history stored per light
CO₂
emissions included in every energy report
11
built-in recommendation rules
Automatic PDF reports
Asset status, energy report and management summary – daily, weekly or monthly, straight to your inbox.
Costs & top consumers
Reports break down consumption, costs, CO₂ emissions and the biggest consumers – the basis for targeted modernisation.
Meters in the system
Meter readings, capacity utilisation and automatic alerts on consumption spikes or missing readings.
Maintenance & faults
Detect faults before the phone rings.
LI Control detects faults automatically from telemetry and DALI diagnostics, alerts the right people and documents every maintenance task end to end.
- Automatic fault detection
- Driver and light-source failures (D4i), over- and undervoltage, thermal issues and missing telemetry are detected automatically and flagged on the map.
- Alerts where the work happens
- Notifications via email or webhook, filtered by type and severity – with cooldown periods to prevent alert spam.
- Inspection schedules
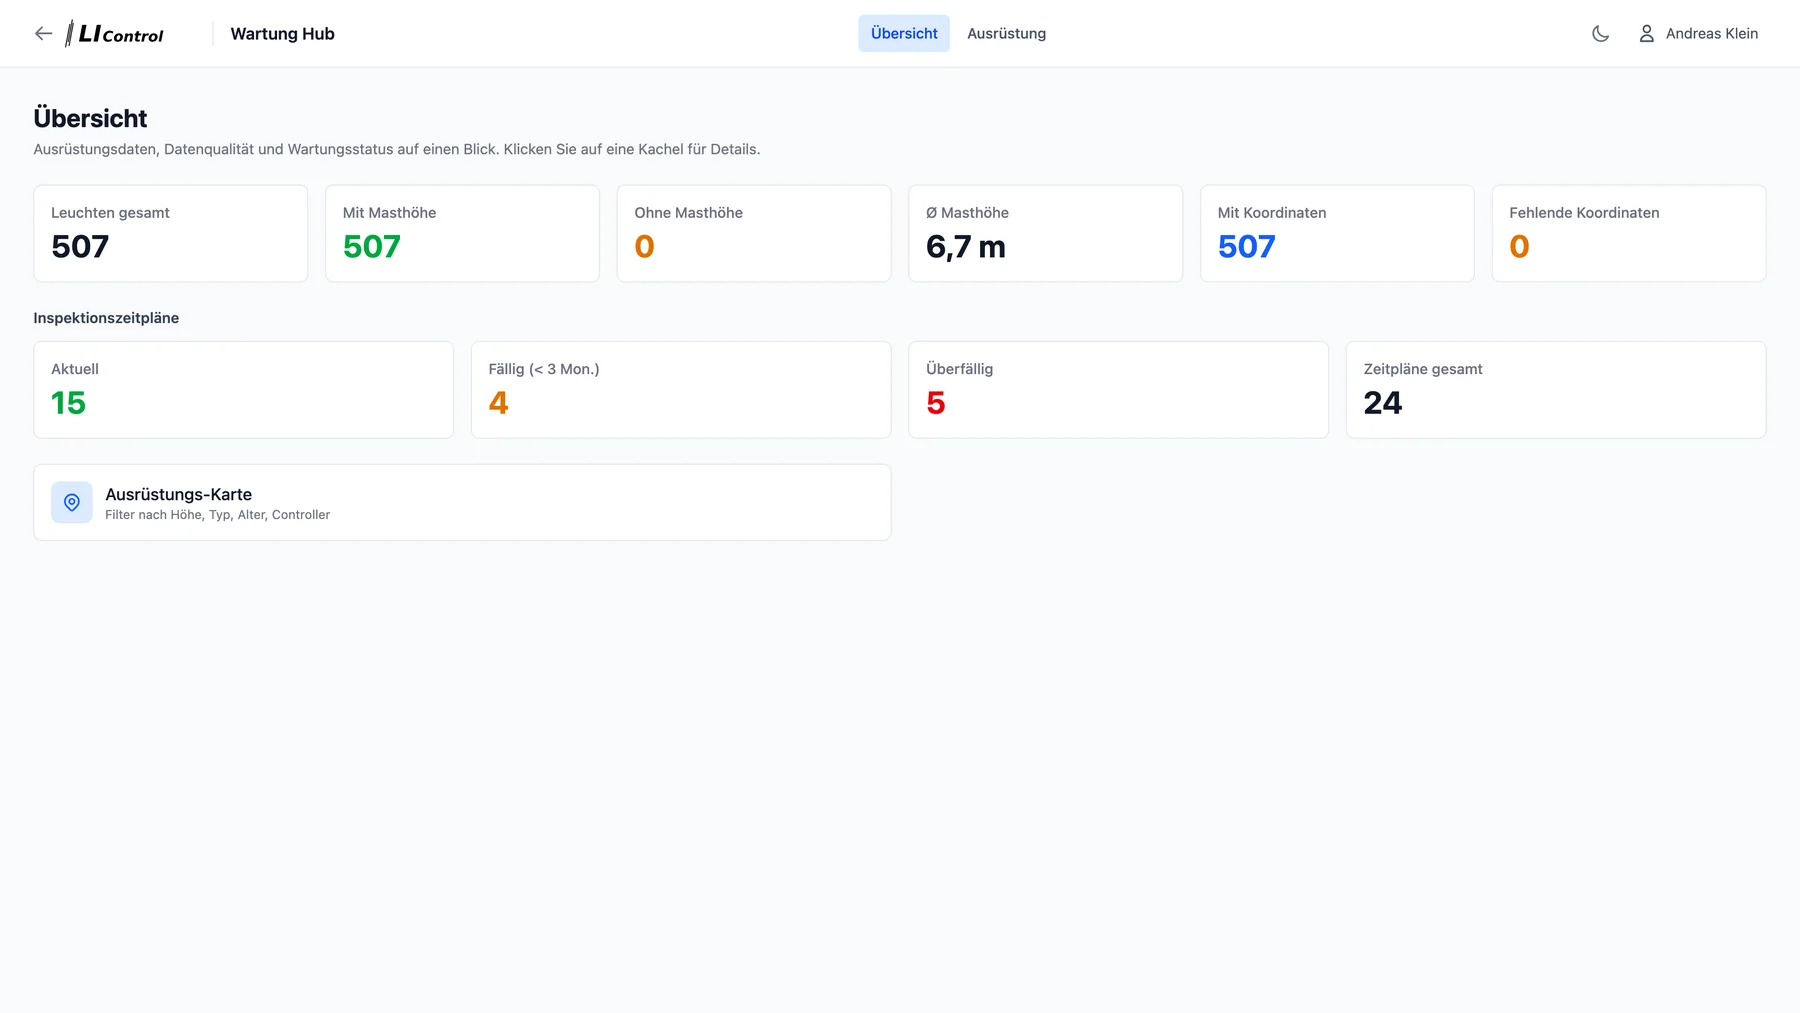
- Due and overdue inspections per light at a glance – including a bulk "inspected" action after the site visit.
- Complete maintenance history
- Lamp replacement, repair, pole inspection, cleaning – every task documented with person, date and notes.
Integrations & data
Open to your system landscape.
LI Control fits into your existing infrastructure instead of replacing it – from the LoRaWAN network server to MQTT.
Connectivity
- Excel in, Excel out
- Bulk import with preview, export of all luminaire data for external analysis – your data stays your data.
- Data routing
- Rule-based forwarding of telemetry to third-party systems – via HTTP, MQTT or as an internal alert.
Next step
See your city in LI Control.
Request the product brochure – or experience LI Control in a live demo, ideally with your own use cases.